
Using Google Trends to maximize your Threat Intelligence and Threat Landscape
Using Google Trends to maximize your Threat Intelligence and Threat Landscape
On the back of the announcement that Google Clouds public dataset program is available, I want to highlight some ideas. I’ve always been a fan of Google Trends when it comes to visualizing the Threat Landscape of customers regarding Threat Intelligence.
I normally use certain queries to visualize the interest into the brand across the world, which also helps to describe the to be expected traffic to a website. For example if Google trends tells you that your brand has a spike in searches in China, Google would also make clear the why.
As an example I added a Trends picture which shows two companies, one a global player in network infrastructure and security and one a local bank in Europe with headquarter in the Netherlands.
You can use Google Trends to visualize interest in a brand, you can use the result to simply see the interest in the brand, but also as a detector for outages or markets on which your company is active.


For the red one we would expect to see traffic from Spain, France and even Turkey. For blue it’s a different matter, this is what we expect as a global company also has a global food print with more people being interested. Google Trends also gives you an overview of the related search queries.
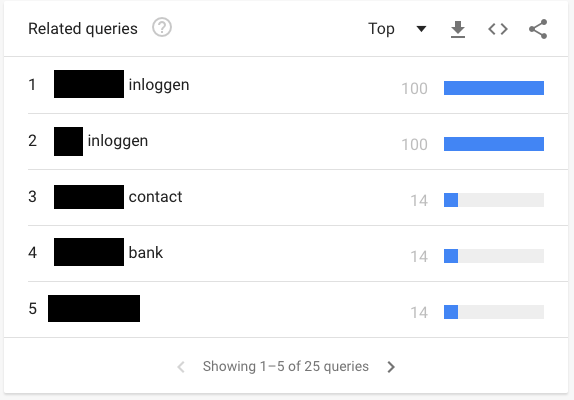
The picture (#1)below shows the top related queries for the dutch bank, the queries look rather normal and may indicate that everything is okay. The picture #2 shows the capabilities when looking into a specific search term, where we explicit look for the word outage combined with the bank name, and we can see that in May 2018, 100% of all queries has been about on outage, which also means that you would have been able to spot the trend directly within some hours.
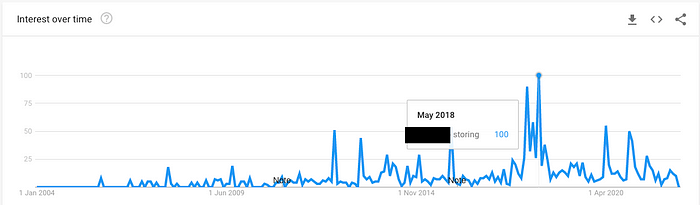
Additionally trending Google searches are displayed, which can come pretty handy when you want to measure the impact of a system outage or even identify certain areas where the website or service are affected.
For example, back in May 2018, we have seen DDoS attacks against all major Banks in the Netherlands. You can see that related searches differ from region to region, leading to the assumption that the DDoS attack had a bigger impact in Rotterdam then Utrecht.

You can identify that there is a certain spike in queries like “<bank name> storing”, meaning unavailability or outage. You can trim the data down to cities or regions, which is an handy tool to check for problems with the CDN (Content Delivery Network) for more details. I find this quite interesting, as you may identify origins of issues.
But back to the article which motivated me for this entry.
The data which was made available is Google Search data from Google themselves and this is a first. It includes the Top 25 searches of the last 30 days. It is accessible like all the data in such a project via the cloud platform and the analytics hub.
The data includes meta data which goes down to the level of cities and is updated on a daily basis. Of course, the top 25 searches may not be interesting for security, but it is an interesting data set.
The data is updated on a daily basis.
Links:
That’s it for today, please leave a 👏 and be excellent to each other

